Relaxation
Relaxation
MRI image contrast is influenced by several characteristics of tissues and other materials including: T1, T2 and T2* relaxation as well as spin density, susceptibility effects and flow effects. This page and the following detailed pages on relaxation parameters will introduce properties and effects on imaging contrast, time and signal-to-noise ratio (SNR).
Relaxation is the process in which spins release the energy received from a radiofrequency pulse.
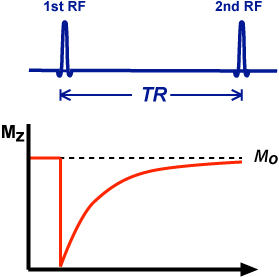
T1 and T2 relaxation rates affect the SNR in an image. Improvement in the SNR is seen when the TR is increased significantly to about 3-5 T1 times. Changing the TR time will also affect the T1 weighting of the image and the acquisition time. T1 weighting occurs in a short TR spin echo sequence because of incomplete recovery of longitudinal magnetization. The effect of TR on SNR can be shown graphically by a T1 relaxation curve as illustrated in the exponential growth curve in figure 1.
As the TR is increased to several times the T1, the longitudinal magnetization has time to recover with resulting improvement in SNR.
Decrease in SNR is seen with an increase the TE secondary to T2 effects in spin echo sequences, and T2* effects in gradient echo sequences. The exponential decay curve in figure 2 illustrates the loss of signal with time.
Decrease in SNR is seen with an increase the TE secondary to T2 effects in spin echo sequences, and T2* effects in gradient echo sequences. The exponential decay curve in figure 2 illustrates the loss of signal with time.
In spite of the decrease in SNR, we deliberately increase the TE to improve the T2 weighting (contrast) of an image. Ideally, we would want a long TR of several T1 times to minimize the T1 effects in a T2 weighted sequence.
 |
| fig. 1 |
 |
| fig. 2 |


Comments
Post a Comment